Your Menu Is Leaking Money. We'll Find It.
We turn your menu data into a clear, human-reviewed report that shows where your menu is underperforming, where the best opportunities are, and what to fix first.
How it works
Get started in
3 simple steps
Get your custom menu analysis report in just 2 business days

Download the Template
Download our simple Excel template and fill in your menu items, prices, and costs. Takes about 15 minutes.

Upload Your Data
Upload your completed template through our secure form. That's all we need from you.

Get Your Report
Receive a custom PDF report showing exactly where you're losing money and how to fix it. Delivered in 2 business days.
Receive a custom PDF report showing exactly where you're losing money and how to fix it.
Get Your Report
How it works
Get started in
3 simple steps
Get your custom menu analysis report in just 2 business days
Download the Template
Download our simple Excel template and fill in your menu items, prices, and costs. Takes about 15 minutes.
Upload Your Data
Upload your completed template through our secure form. That's all we need from you.
Get Your Report
Receive a custom PDF report showing exactly where you're losing money and how to fix it. Delivered in 2 business days.
Receive a custom PDF report showing exactly where you're losing money and how to fix it.
Get Your Report
Results
Real numbers from real restaurants
Here's what ProfitLens typically finds in a single report
Average Monthly Savings Found
$2,100
$2,100
Most restaurants discover thousands in hidden profit leaks they never knew existed.
Average Monthly Savings Found
$2,100
$2,100
Most restaurants discover thousands in hidden profit leaks they never knew existed.
Average Monthly Savings Found
$2,100
$2,100
Most restaurants discover thousands in hidden profit leaks they never knew existed.
Menu Items to Reprice
3-6
3-6
The average restaurant has several items priced too low or too high for maximum profit.
Menu Items to Reprice
3-6
3-6
The average restaurant has several items priced too low or too high for maximum profit.
Menu Items to Reprice
3-6
3-6
The average restaurant has several items priced too low or too high for maximum profit.
Report Delivery
2 days
2 days
A complete custom analysis in 2 business days
Report Delivery
2 days
2 days
A complete custom analysis in 2 business days
Report Delivery
2 days
2 days
A complete custom analysis in 2 business days
How We Compare
See why restaurant owners choose ProfitLens over the alternatives.
| Alternative | Their Price | The Problem | ProfitLens ✓ |
|---|---|---|---|
| Restaurant Consultants | $2,000–$10,000+ | Expensive, slow, takes weeks | $99. Delivered in 2 days. |
| POS System Reports | Included in POS | Shows sales only — no profit analysis | Full profit, waste & labor analysis |
| DIY Spreadsheets | Free (your time) | Most owners lack time & skill | Pro-grade output, zero skill needed |
| Generic AI Tools | $0–$20/mo | Generic advice, not your real data | Custom analysis of YOUR numbers |
✦ What You Get
Everything you need to boost your profit
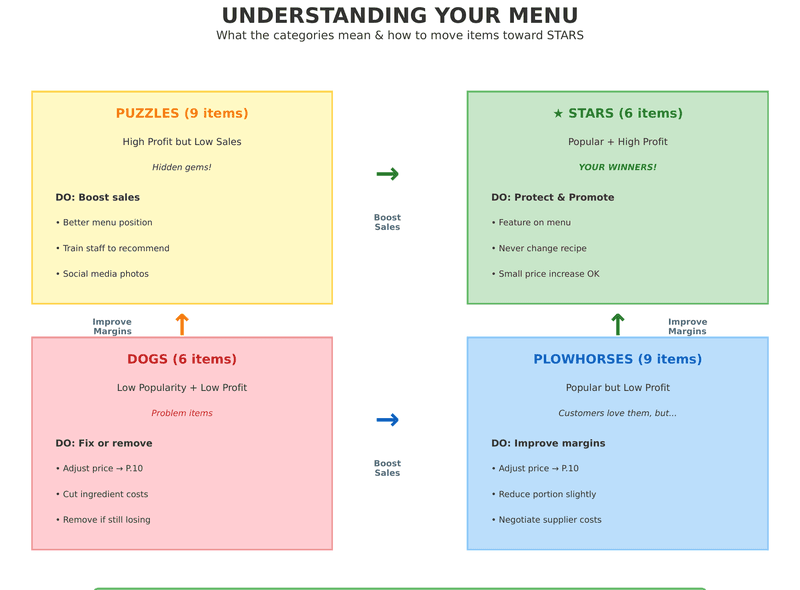
Menu Performance Matrix
Every item rated as a Star, Plowhorse, Puzzle, or Dog
Menu Performance Matrix
Every item rated as a Star, Plowhorse, Puzzle, or Dog
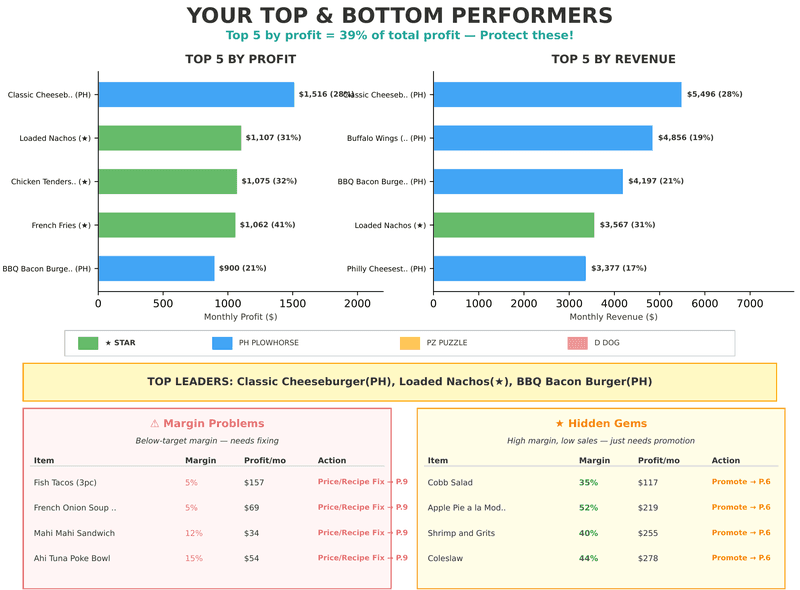
Profit Leak Analysis
See exactly where money is slipping away
Profit Leak Analysis
See exactly where money is slipping away
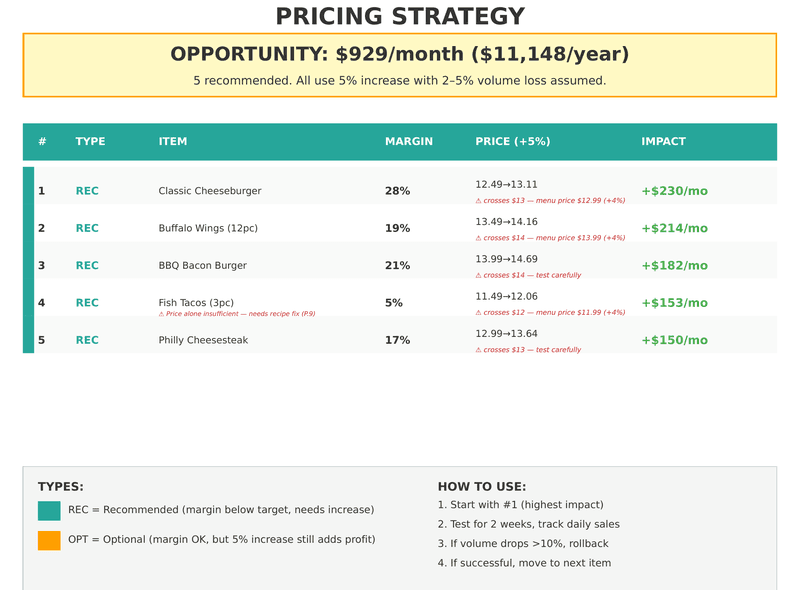
Pricing Recommendations
Specific price adjustments for each item
Pricing Recommendations
Specific price adjustments for each item
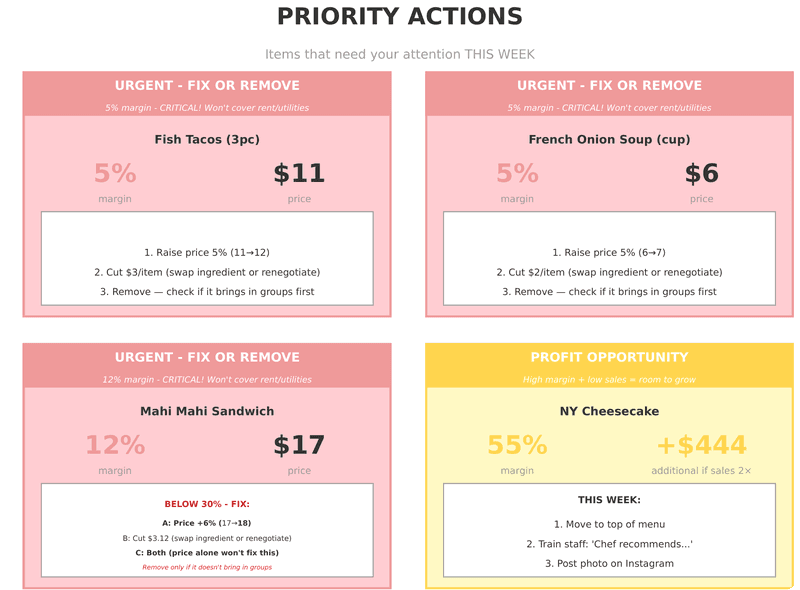
Action Plan
Step-by-step list of what to change first
Action Plan
Step-by-step list of what to change first

Waste & Cost Analysis
Identify where food costs are eating into margins
Waste & Cost Analysis
Identify where food costs are eating into margins
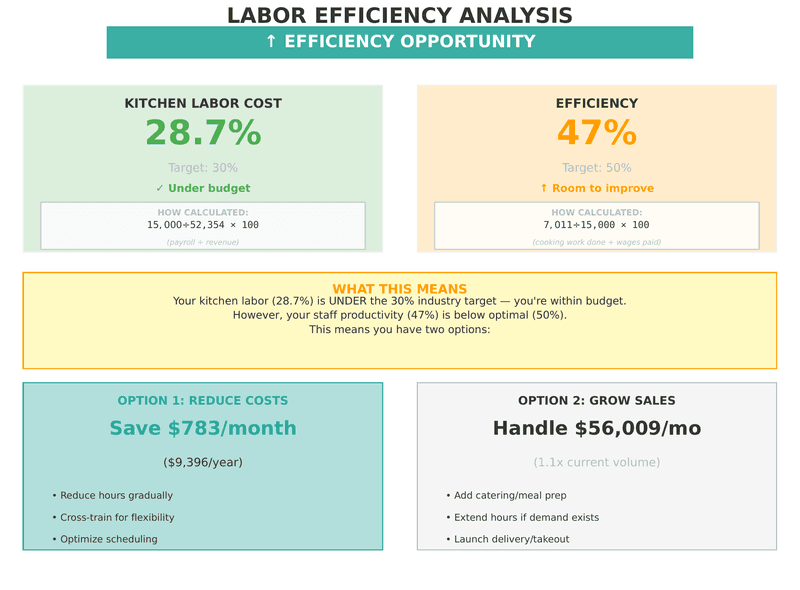
Labor Efficiency Review
See how staffing costs compare to revenue